The $4.1 Trillion AI Contender - Why AAPL's Silent Shift is the Real Story

The $4.1 Trillion AI Contender: Why AAPL's Silent Shift is the Real Story
Forget the daily noise about whether the iPhone 17 will be thin enough or if Vision Pro sales are hitting expectations. That’s a distraction. The real story for Apple, the colossal $AAPL, is its stealth transformation into a high-margin, recurring revenue fortress. While the market is obsessed with the AI arms race—and whether Apple can catch up to Nvidia or Google—the financial data suggests Apple is executing a fundamentally different, and arguably safer, strategy. Recent news reports highlight Alphabet's AI push and Apple’s own antitrust struggles, particularly the massive $38 billion fine risk in India over its in-app payment system. These geopolitical and competitive headwinds are real, but they obscure the underlying financial reality: Apple’s ecosystem is becoming bulletproof, powered by services and a relentless capital return program. This isn't a hardware company anymore; it’s a financial machine that uses beautiful hardware as its distribution platform.
Margin Expansion Proves the Ecosystem is Bulletproof
Let's cut straight to the numbers. When we look at the financials reported through the end of Q3 2025, the picture is one of impressive resilience and margin expansion, completely defying the narrative of a maturing, stagnant giant. Total revenue reached $94.036 billion in Q3 2025, marking a solid jump from the $85.777 billion reported in Q3 2024. This isn’t explosive growth, but for a company of this scale, stability matters most.
The real insight, however, lies in the profitability metrics. Gross Profit hit $43.718 billion in Q3 2025. When we calculate the Gross Margin (Gross Profit / Revenue), we see a subtle but powerful trend. In Q3 2025, Apple generated a 46.49% Gross Margin. This is slightly higher than the 46.26% reported just one year prior in Q3 2024. This margin creep is a massive signal that the mix is shifting favorably, favoring the sticky, high-value parts of the business.
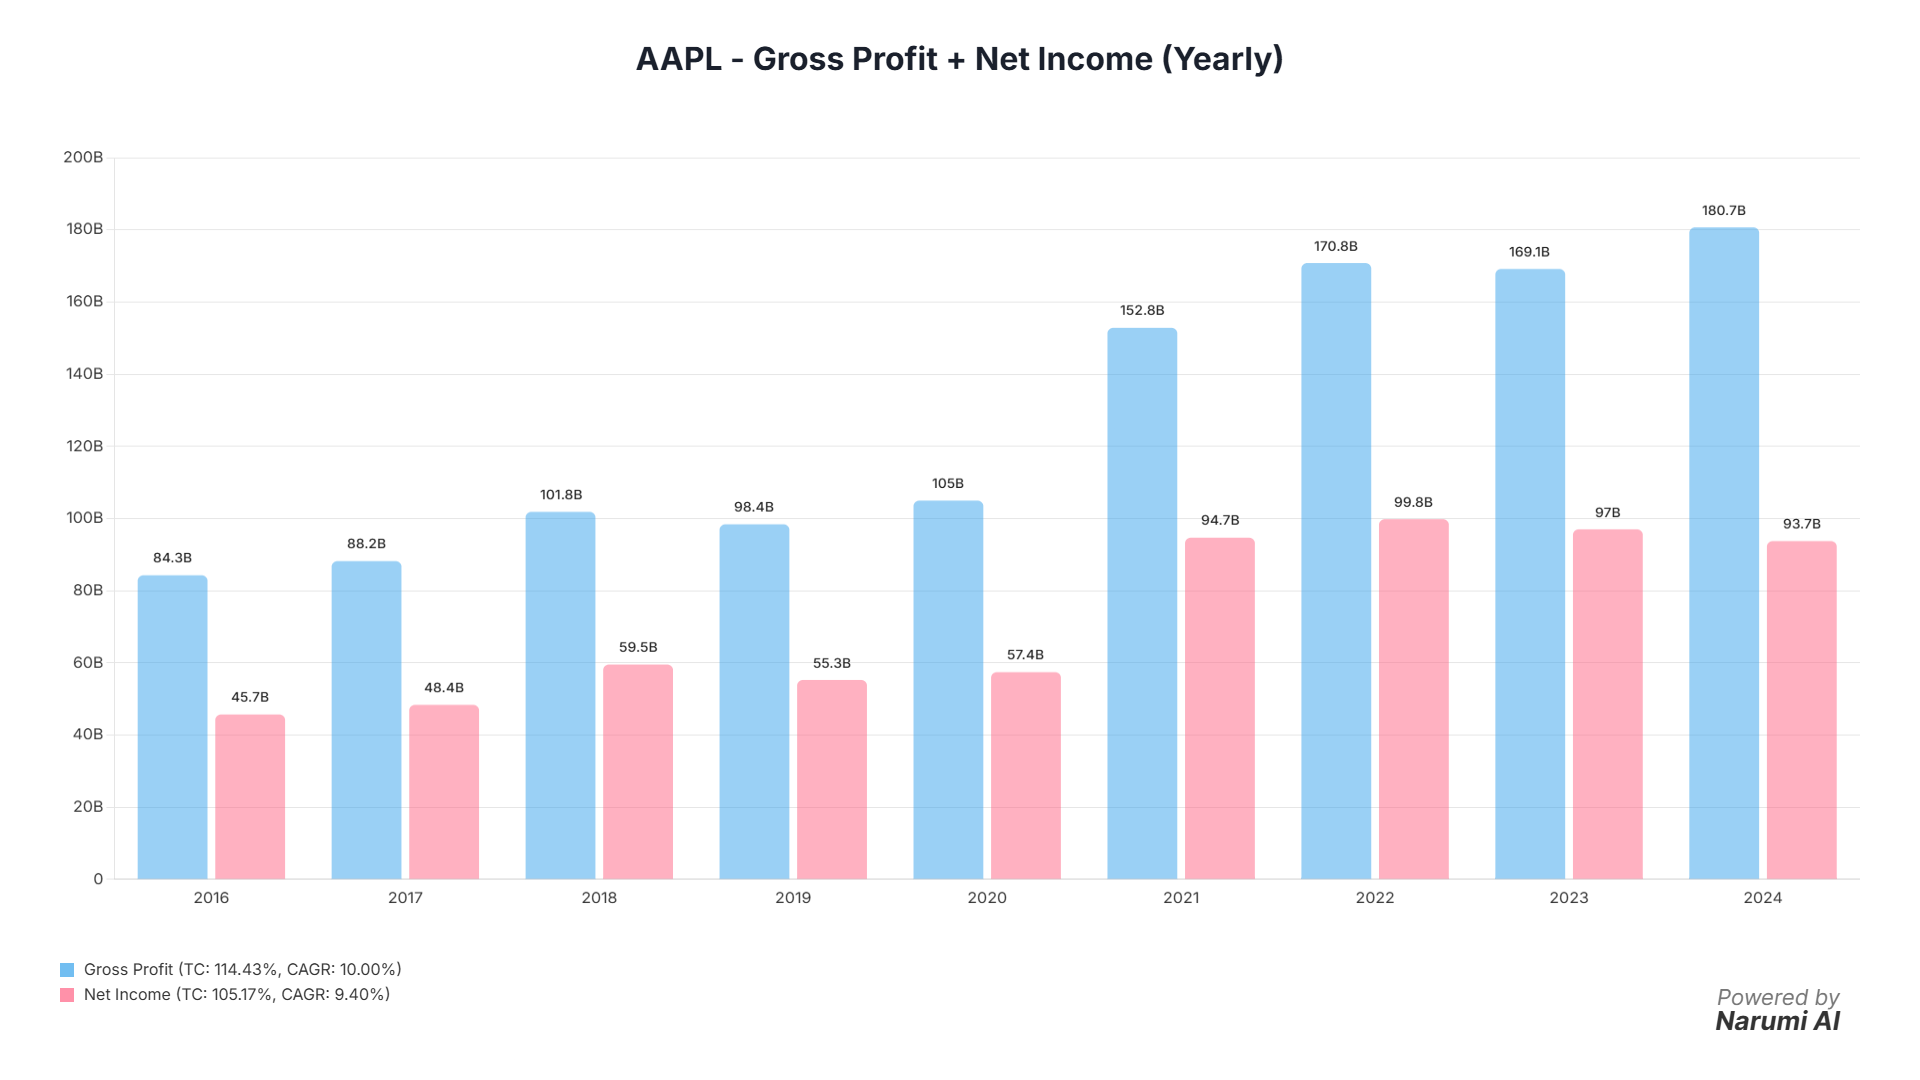
Operating Income followed suit, hitting $28.202 billion in Q3 2025, translating to a robust 30.0% Operating Margin. Compare this to the volatile margins seen in hardware-heavy companies, and you realize Apple operates less like a manufacturer and more like a software powerhouse. The financial health is further cemented by their capital allocation strategy. In 2024, the company’s Repurchase of Common Stock reached an astonishing:
Apple returned $94.949 billion to shareholders through common stock repurchases in 2024 alone.
This aggressive share reduction supports Diluted EPS, which hit $6.08 in 2024. While headlines fret over antitrust risks in India—a genuine threat that could result in multi-billion dollar fines—the hard data shows a company generating massive, high-quality free cash flow ($108.807 billion in 2024) and returning it systematically to shareholders. The news noise doesn't match the clean profitability data.
The Services Segment is the Quiet Engine Hitting 46% Gross Margin
To understand where that margin expansion is coming from, we must dive into the segment data—the stuff the mainstream analysts usually gloss over. The narrative that Apple is solely reliant on the iPhone is outdated. The Services Segment is the true growth engine, providing the stability and high margins that insulate Apple from cyclical hardware dips.
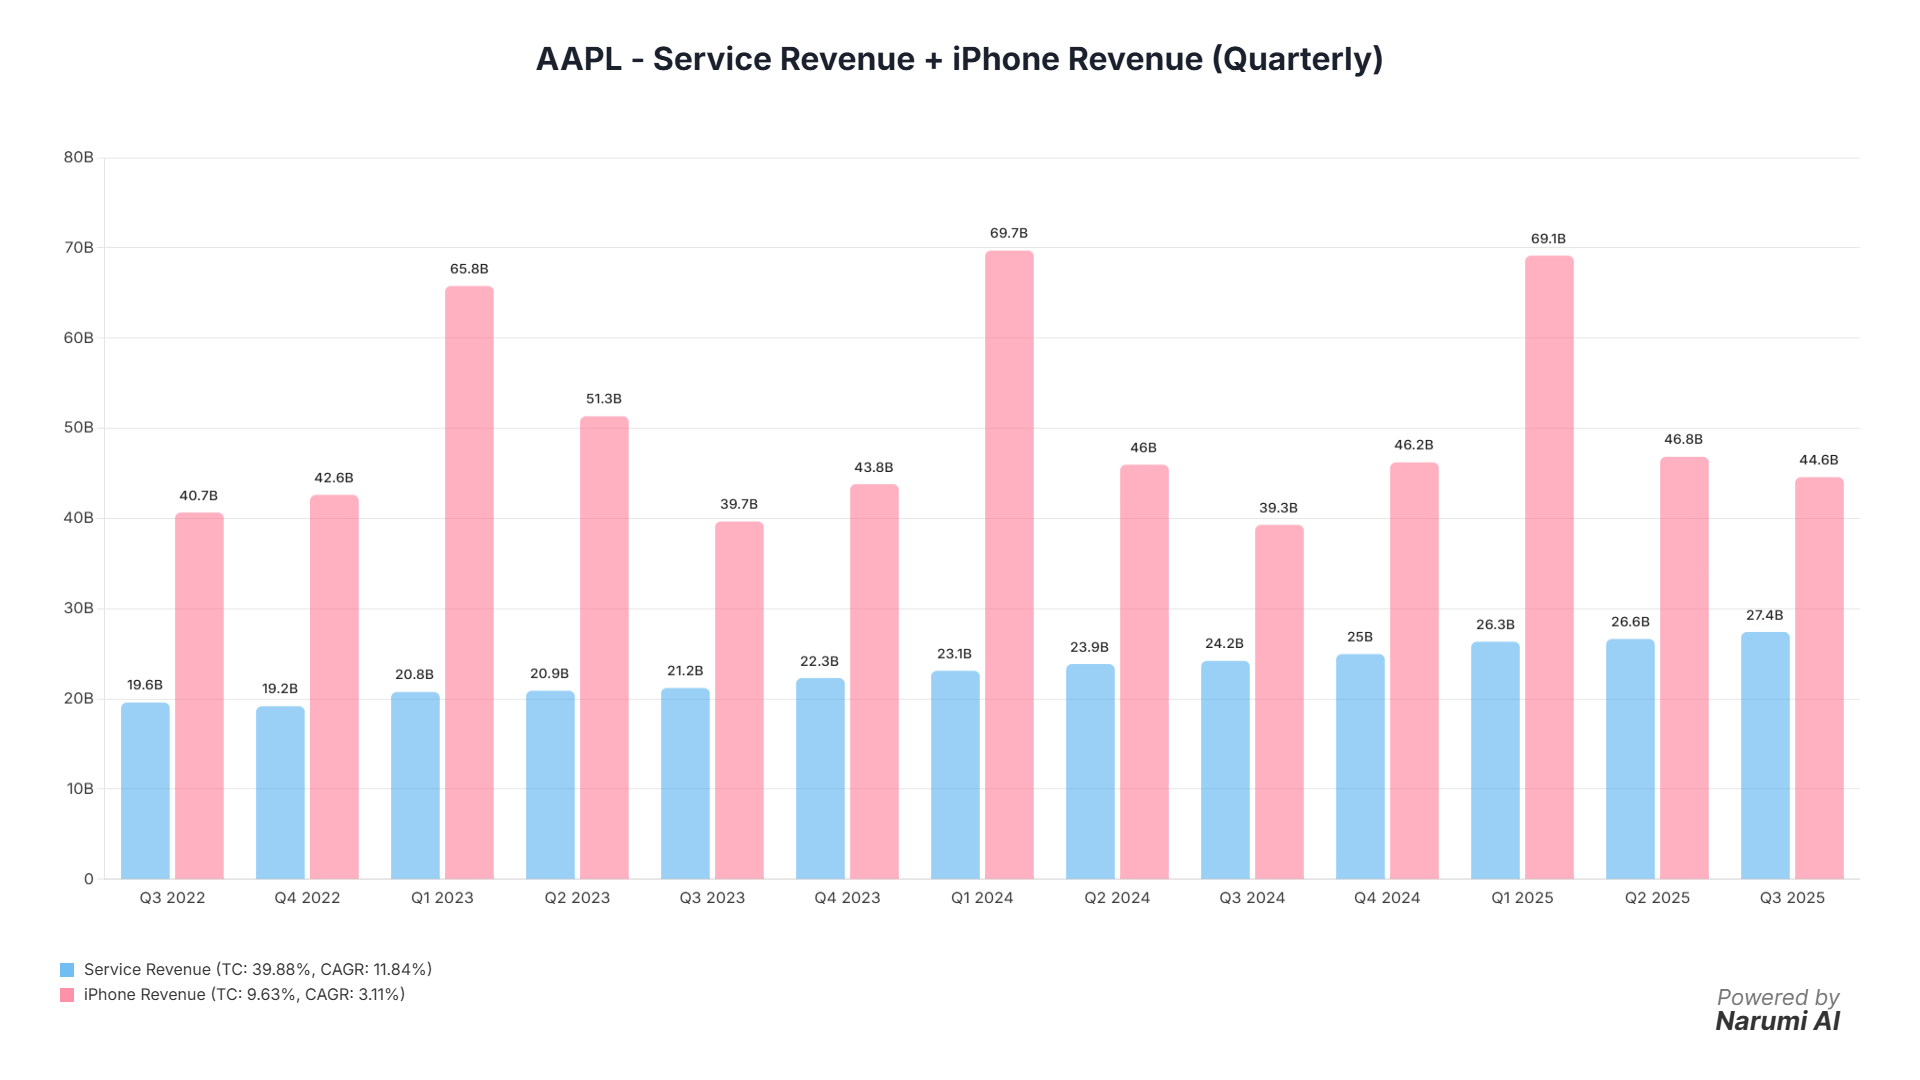
Let’s look at the Services Revenue growth year-over-year. In Q3 2024, Services Revenue was $24.213 billion. By Q3 2025, it had reached $27.423 billion. That is a 13.26% jump in one year, vastly outpacing overall revenue growth. This continuous, double-digit expansion from subscriptions, the App Store, Apple Music, and iCloud is why the Gross Margin is so high and so stable.
It’s not just Services carrying the load, though. The core iPhone Revenue also demonstrated impressive resilience, hitting $44.582 billion in Q3 2025, up 13.45% from $39.296 billion in Q3 2024. This suggests that the premiumization trend and the slow-burn replacement cycle, potentially fueled by early chatter about on-device AI capabilities, continue to drive the flagship product.
Now, let's address the elephant in the room: China. The news is full of doom regarding geopolitical tension and competition. While annual Greater China revenue did dip in 2024 to $66.952 billion (down from $72.559 billion in 2023), the latest quarterly data shows stabilization. Greater China segment revenue reached $15.369 billion in Q3 2025, a modest but meaningful increase over $14.728 billion in Q3 2024. Meanwhile, the Europe Segment, often overlooked, is a powerhouse in its own right, delivering $24.014 billion in Q3 2025, showcasing the true geographic diversification of the ecosystem.
Can the Buyback Machine Outrun Regulatory Risk?
As analysts, we must constantly challenge the bull thesis. Here are three tough questions a bear would ask about $AAPL right now:
Q: Is Apple's financial structure fundamentally sound, given that Retained Earnings turned negative in 2022 and Total Liabilities ($308.030B in 2024) are high relative to Total Assets ($364.980B)?
A: While Retained Earnings dipped into the negative territory starting in 2022, this is a function of the massive, decades-long capital return program, specifically the aggressive share repurchases, rather than operational losses. The company is literally distributing its cumulative earnings back to shareholders. Operationally, the balance sheet remains extremely liquid. Total Cash and Short Term Investments stood at $65.171 billion in Q4 2024, and the company’s ability to generate operating cash flow ($118.254 billion in 2024) easily covers its debt obligations, which are largely used to fund the buybacks at favorable rates.
Q: Geopolitical risk is spiking, specifically in India and China. How exposed is the model to regulatory fines and market rejection?
A: The India antitrust challenge, centered on the Competition Commission of India (CCI) using worldwide turnover for fines, is a major headache. However, financially, the European segment ($101.328B revenue in 2024) is already significantly larger than Greater China ($66.952B in 2024). Furthermore, the Services segment acts as a crucial buffer. Its high margin and recurring nature stabilize the overall P&L, making the company less vulnerable to unit fluctuations in any single geographic market. The risk is high, but the damage is highly diversified.
Q: Is Apple spending enough on R&D to win the next generation of AI against hyper-spending competitors like Alphabet and Nvidia?
A: Apple's R&D spend has continued its steady climb, reaching $31.370 billion in 2024, up from $29.915 billion in 2023. Critically, Apple’s model is different. The news highlights competitors spending billions on expensive Nvidia GPUs and data centers. Apple, however, designs its own silicon (M-series, A-series), giving it a structural advantage. Its Capital Expenditures (CapEx) were only $9.447 billion in 2024, significantly lower than other tech giants. This efficiency suggests Apple can integrate AI features directly into its devices (on-device AI) at a fraction of the infrastructure cost required by its peers, relying on superior vertical integration rather than brute-force spending.
The Long-Term Sticky Thesis Prevails
Apple is not a stock for explosive, short-term AI pumps, but it is arguably the highest-quality compounder in the world. The shift to a Services-dominant revenue mix, coupled with the continued strength of the iPhone replacement cycle, provides stability rarely seen at this valuation tier. The company’s ability to generate massive free cash flow while systematically reducing its share count ensures that EPS growth remains strong, regardless of macro headwinds. While regulatory risks are certainly worth monitoring, the core financial engine is running hot. It remains a core HOLD with a strong leaning towards long-term accumulation.
If you want to play around with these metrics yourself, check out our Interactive Charting Tool and other features to build your own dashboard."